Friday, May 24, 2024

Probability and Statistical Operation Using Python

 STATISTICS AND POBABILITY 

STATISTICS:
The process of gathering information, tabulating it, and interpreting it numerically is known as statistics in general. This branch of applied mathematics deals with the gathering, analysing, interpreting, and presenting of data. We can see how data can be utilised to tackle complicated problems with statistics.

This tutorial will teach us how to use Python to solve statistical issues and explain the underlying theory. To begin with, let us grasp a few ideas that will be helpful in this post.

Statistics


Descriptive statistics, in general, refer to the description of the data using certain representative techniques, such as tables, charts, Excel files, etc. The way the data is presented allows it to convey some important information that may be utilised to identify potential trends in the future. Univariate analysis is the process of describing and summarising a single variable. Bivariate analysis is the process of describing a statistical relationship between two variables. Multivariate analysis is the process of describing the statistical relationship between several variables.

There are two types of Descriptive Statistics:

  • The measure of central tendency
  • Measure of variability
The measure of central tendency:
  • Mean: It is the sum of observations divided by the total number of observations. It is also defined as average which is the sum divided by count. 
  • Median: It is the middle value of the data set. It splits the data into two halves. If the number of elements in the data set is odd then the centre element is the median and if it is even then the median would be the average of two central elements. it first sorts the data i=and then performs the median operation
  • Mode: It is the value that has the highest frequency in the given data set. The data set may have no mode if the frequency of all data points is the same. 
Measure of Variability:
  • Range: The difference between the largest and smallest data point in our data set is known as the range. The range is directly proportional to the spread of data which means the bigger the range, the more the spread of data and vice versa.
  • Variance: It is defined as an average squared deviation from the mean. It is calculated by finding the difference between every data point and the average which is also known as the mean, squaring them, adding all of them, and then dividing by the number of data points present in our data set.
  • Standard deviation: It is defined as the square root of the variance. It is calculated by finding the Mean, then subtracting each number from the Mean which is also known as the average, and squaring the result. Adding all the values and then dividing by the no of terms followed by the square root.
PROBABILTY DISTRIBUTION:
probability Distribution represents the predicted outcomes of various values for a given data. Probability distributions occur in a variety of forms and sizes, each with its own set of characteristics such as mean, median, mode, skewness, standard deviation, kurtosis, etc. Probability distributions are of various types let’s demonstrate how to find them in this article.
PD


There are three types of Probability Distribution:
  • Normal: The normal distribution is a symmetric probability distribution centered on the mean, indicating that data around the mean occur more frequently than data far from it. the normal distribution is also called Gaussian distribution. The normal distribution curve resembles a bell curve. 
  • Binomial: if an experiment is successful or a failure. if the answer for a question is “yes” or “no” etc. np.random.binomial() is used to generate binomial data. n refers to a number of trails and prefers the probability of each trail. 
  • Poisson's: A Poisson distribution is a kind of probability distribution used in statistics to illustrate how many times an event is expected to happen over a certain amount of time. It’s also called count distribution. np.random.poisson.function() is used to create data for poisson distribution.
As, I previously said during the journey I will take readers through hand on journey. I am providing the link of folder which is freely accessible where I have posted various documents in which i have implemented the model on easiest level. Any beginner can easily understand the models.
Those models are implemented in "Jupyter notebook" which is the platform for implementing python projects. 


Kindly, refer the link provided below:


With the end of this blog we covered all the basics of Machine Learning. I hope i delivered the enough amount of knowledge for basics of ML and my readers would be happy and satisfied.


THANK YOU ALL FOR SUPPORTING ME AND HOPING THE SAME GOOD RESPONSE FROM YOU GUYS ....!


VERY IMP LIBRARY IN PYTHON: MATPLOTLIB

 MATPLOTLIB

Matplotlib is a comprehensive library for creating static, animated, and interactive visualizations in Python. It is widely used for its flexibility and ease of use, allowing users to generate plots and charts with just a few lines of code. Here’s a more detailed overview of Matplotlib:

Key Features of Matplotlib

  1. Versatile Plot Types: Matplotlib supports a variety of plot types, including line plots, scatter plots, bar plots, histograms, pie charts, and more.
  2. Customization: Almost every aspect of a plot can be customized, from colors and line styles to labels and annotations.
  3. Integration: Matplotlib integrates well with other libraries such as NumPy, Pandas, and SciPy, making it ideal for scientific and engineering applications.
  4. Interactive Plots: It can be used to create interactive plots that can be embedded in graphical user interfaces (GUIs) using toolkits such as Tkinter, wxPython, Qt, or GTK.
  5. Publication Quality: Matplotlib produces high-quality figures suitable for publication in scientific journals.

Installation

To install Matplotlib, use pip:

"pip install matplot lib"

Basic Components of MATPLOT lib figure:

  • Figures in Matplotlib: The Figure object is the top-level container for all elements of the plot. It serves as the canvas on which the plot is drawn. You can think of it as the blank sheet of paper on which you’ll create your visualization.
  • Axes in Matplotlib: Axes are the rectangular areas within the figure where data is plotted. Each figure can contain one or more axes, arranged in rows and columns if necessary. Axes provide the coordinate system and are where most of the plotting occurs.
  • Axis in Matplotlib: Axis objects represent the x-axis and y-axis of the plot. They define the data limits, tick locations, tick labels, and axis labels. Each axis has a scale and a locator that determine how the tick marks are spaced.
  • Marker in Matplotlib: Markers are symbols used to denote individual data points on a plot. They can be shapes such as circles, squares, triangles, or custom symbols. Markers are often used in scatter plots to visually distinguish between different data points.
  • Adding lines to Figures: Lines connect data points on a plot and are commonly used in line plots, scatter plots with connected points, and other types of plots. They represent the relationship or trend between data points and can be styled with different colors, widths, and styles to convey additional information.
  • Matplotlib Title: The title is a text element that provides a descriptive title for the plot. It typically appears at the top of the figure and provides context or information about the data being visualized.
  • Axis Labels in Matplotlib: Labels are text elements that provide descriptions for the x-axis and y-axis. They help identify the data being plotted and provide units or other relevant information.
  • Matplotlib Legend: Legends provide a key to the symbols or colors used in the plot to represent different data series or categories. They help users interpret the plot and understand the meaning of each element.
  • Matplotlib Grid Lines: Grid lines are horizontal and vertical lines that extend across the plot, corresponding to specific data intervals or divisions. They provide a visual guide to the data and help users identify patterns or trends.
  • Spines of Matplotlib Figures: Spines are the lines that form the borders of the plot area. They separate the plot from the surrounding whitespace and can be customized to change the appearance of the plot borders.
Types of Plots:
  • Line Graph
  • Stem Plot
  • Bar chart
  • Histograms
  • Scatter Plot
  • Stack Plot
  • Box Plot
  • Pie Chart
  • Error Plot
  • Violin Plot
  • 3D Plots 
MATPLOT LIB is very important libary along with numpy and pandas.
There is reason behind it , as Machine learning comes with data sets and these data set are only indicates with charts and graph very efficiently and effictively. Without chart Machine Learning is nothing. Then, to visualise those charts and graph this library is very important and that is why hands on experience is very important for easy and effective way. I am providing the link of file where readers can get separate Jupyter notebook  for their studies and same file can be downloaded and can be used for their use.

Matplot lib Notebook:


References:
1)https://www.w3schools.com/python/matplotlib_intro.asp#:~:text=Matplotlib%20is%20a%20low%20level,and%20Javascript%20for%20Platform%20compatibility.

STAIR TWO: HIERARCHICAL CLUSTERING

 HIERARCHICAL CLUSTERING

Hierarchical Clustering is a method of cluster analysis in data mining that creates a hierarchical representation of the clusters in a dataset. The method starts by treating each data point as a separate cluster and then iteratively combines the closest clusters until a stopping criterion is reached. The result of hierarchical clustering is a tree-like structure, called a dendrogram, which illustrates the hierarchical relationships among the clusters.

Hierarchical clustering has several advantages over other clustering methods:

  • The ability to handle non-convex clusters and clusters of different sizes and densities.
  • The ability to handle missing data and noisy data.
  • The ability to reveal the hierarchical structure of the data, which can be useful for understanding the relationships among the clusters.

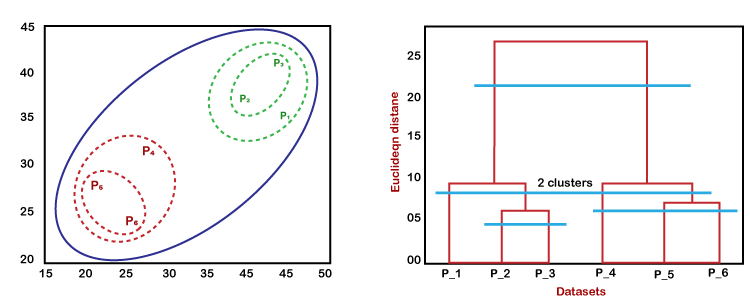
The dendrogram is a tree-like structure that is mainly used to store each step as a memory that the HC algorithm performs. In the dendrogram plot, the Y-axis shows the Euclidean distances between the data points, and the x-axis shows all the data points of the given dataset.

The working of the dendrogram can be explained using the below diagram:

Hierarchical Clustering in Machine Learning
  • In the above diagram, the left part is showing how clusters are created in agglomerative clustering, and the right part is showing the corresponding dendrogram.
  • As previously said, the datapoints P2 and P3 come together to form a cluster, and as a result, a dendrogram connecting P2 and P3 in a rectangle shape is made. 
  • The Euclidean distance between the data points is used to determine the height.
  • P5 and P6 cluster together in the following stage, and the matching dendrogram is made. 
  • Given that the Euclidean distance between P5 and P6 is somewhat larger than that between P2 and P3, it is higher than it was previously.
  • Once more, two new dendrograms are made, one combining P1, P2, and P3 and the other combining P4, P5, and P6.
    Eventually, all of the data points are combined to generate the final dendrogram.

We can cut the dendrogram tree structure at any level as per our requirement.


As, I previously said during the journey I will take readers through hand on journey. I am providing the link of folder which is freely accessible where I have posted various documents in which i have implemented the model on easiest level. Any beginner can easily understand the models.
Those models are implemented in "Jupyter notebook" which is the platform for implementing python projects. 


Kindly, refer the link provided below:


References:
1)https://www.geeksforgeeks.org/hierarchical-clustering-in-data-mining/

STAIR ONE: CLUSTERING

 CLUSTERING

Cluster analysis, or clustering, is the process of arranging data points into groups according to how similar they are to one another. This approach falls under the category of unsupervised learning, which, in contrast to supervised learning, does not have a goal variable and instead seeks to extract insights from unlabeled data points.

The goal of clustering is to create homogeneous groups of data points from a diverse dataset. The points with the highest similarity score are then grouped together after the similarity is assessed using a metric such as Euclidean distance, Cosine similarity, Manhattan distance, etc.

For Example, in the graph given below, we can clearly see that there are 3 circular clusters forming on the basis of distance.

Now it is not necessary that the clusters formed must be circular in shape. The shape of clusters can be arbitrary. There are many algorithms that work well with detecting arbitrary shaped clusters. 

For example, In the below given graph we can see that the clusters formed are not circular in shape.

A) k- means Clustering:

K-Means clustering is one of the most popular and straightforward clustering algorithms in unsupervised machine learning. It partitions a dataset into K distinct, non-overlapping subsets (clusters) based on similarity, where K is a user-defined parameter. Here’s a detailed overview of K-Means clustering:

The K-Means algorithm works as follows:

  1. Initialization: Select K initial centroids randomly from the dataset. These centroids are the starting points for each cluster.
  2. Assignment: Assign each data point to the nearest centroid based on a distance metric (usually Euclidean distance). This forms K clusters.
  3. Update: Recalculate the centroid of each cluster by taking the mean of all data points assigned to that cluster.
  4. Convergence: Repeat the assignment and update steps until the centroids no longer change significantly, or a maximum number of iterations is reached.
  5. K-Means

Applications of Clustering in different fields:

  1. Marketing: It can be used to characterize & discover customer segments for marketing purposes.
  2. Biology: It can be used for classification among different species of plants and animals.
  3. Libraries: It is used in clustering different books on the basis of topics and information.
  4. Insurance: It is used to acknowledge the customers, their policies and identifying the frauds.
  5. City Planning: It is used to make groups of houses and to study their values based on their geographical locations and other factors present. 
  6. Earthquake studies: By learning the earthquake-affected areas we can determine the dangerous zones. 
  7. Image Processing: Clustering can be used to group similar images together, classify images based on content, and identify patterns in image data.
As, I previously said during the journey I will take readers through hand on journey. I am providing the link of folder which is freely accessible where I have posted various documents in which i have implemented the model on easiest level. Any beginner can easily understand the models.
Those models are implemented in "Jupyter notebook" which is the platform for implementing python projects. 


Kindly, refer the link provided below:


References:
1) https://medium.com/@pranav3nov/understanding-k-means-clustering-f5e2e84d2129


FLOOR TWO: UNSUPERVISED LEARNING

 UNSUPERVISED LEARNING

What is Unsupervised Learning in Machine Learning ?
So, a method which draws output from unlabelled data also. A sort of machine learning method called unsupervised machine learning is used to make conclusions from datasets that contain input data without labelled replies. Unsupervised learning uses data without pre-existing labels, in contrast to supervised learning, which involves training a model on labelled data. Finding hidden patterns, groupings, or features in the data is the main objective.

EXAMPLE: let's say the unsupervised learning algorithm is provided with an input dataset that includes pictures of various breeds of dogs and cats. The algorithm has no knowledge of the dataset's characteristics because it has never been trained on the provided dataset. The unsupervised learning algorithm's job is to let the image features speak for themselves. This work will be completed using an unsupervised learning algorithm that organises the image collection based on image similarities.

Reasons Behind for using Unsupervised Learning:
  • Unsupervised learning helps in identifying hidden patterns and structures in data without any prior assumptions. This is crucial for understanding the inherent distribution and relationships within the data.
  • Helps in identifying the most important features, thus reducing the dimensionality of the data and potentially improving the performance of supervised learning models.
  • Unsupervised learning can identify user preferences and behaviour patterns to provide personalized recommendations without needing explicit feedback.
  • Identifying unusual patterns or outliers in transaction data can help detect fraudulent activities.
Working:
In this case, the incoming data is unlabelled, meaning it is not categorised and no corresponding outputs are provided. The machine learning model is now fed this unlabelled input data in order to train it. It will first analyse the raw data to identify any hidden patterns before applying the appropriate algorithms, including decision trees and k-means clustering, to the data.

After applying the appropriate algorithm, the algorithm groups the data objects based on the similarities and differences among them.
Unsupervised working

UNSUPERVISED Learning having main algorithm:
  1. Clustering:  Clustering is a fundamental technique in unsupervised machine learning that involves partitioning a dataset into distinct groups, or clusters, such that items in the same cluster are more similar to each other than to those in other clusters. Clustering helps in discovering inherent structures in the data, making it useful for a variety of applications, from market segmentation to anomaly detection.

  2. Sub-Types:
K-Means Clustering: Divides the data into K clusters by minimizing the variance within each cluster. It starts with K initial centroids and iteratively refines their positions based on the mean of the points in each cluster.                                                     
Hierarchical Clustering: A bottom-up approach where each data point starts in its own cluster. Clusters are iteratively merged based on a similarity criterion until a stopping condition is met (e.g., the desired number of clusters).

                                                     
Applications :

  • Anomaly detection: Unsupervised learning can identify unusual patterns or deviations from normal behaviour in data, enabling the detection of fraud, intrusion, or system failures.
  • Scientific discovery: Unsupervised learning can uncover hidden relationships and patterns in scientific data, leading to new hypotheses and insights in various scientific fields.
  • Recommendation systems: Unsupervised learning can identify patterns and similarities in user behaviour and preferences to recommend products, movies, or music that align with their interests.
  • Image analysis: Unsupervised learning can group images based on their content, facilitating tasks such as image classification, object detection, and image retrieval.
Advantages:

  • It does not require training data to be labelled.
  • Capable of finding previously unknown patterns in data.
  • Unsupervised learning can help you gain insights from unlabelled data that you might not have been able to get otherwise.
  • Unsupervised learning is good at finding patterns and relationships in data without being told what to look for. This can help you learn new things about your data.
Disadvantages:

  • Difficult to measure accuracy or effectiveness due to lack of predefined answers during training. 
  • The results often have lesser accuracy.
  • The user needs to spend time interpreting and label the classes which follow that classification.
  • Unsupervised learning can be sensitive to data quality, including missing values, outliers, and noisy data.
Difference between Supervised and Unsupervised Machine Learning:

Parameters

Supervised machine learning

Unsupervised machine learning

Input Data

Algorithms are trained using labeled data.

Algorithms are used against data that is not labeled

Computational Complexity

Simpler method

Computationally complex

Accuracy

Highly accurate

Less accurate

No. of classes

No. of classes is known

No. of classes is not known

Data Analysis

Uses offline analysis

Uses real-time analysis of data

Algorithms used

Linear and Logistics regression, Random forest, multi-class classification, decision tree, Support Vector Machine, Neural Network, etc.

K-Means clustering, Hierarchical clustering, KNN,etc.

Output

Desired output is given.

Desired output is not given.

Training data

Use training data to infer model.

No training data is used.

Example 

Example: Optical character recognition.

Example: Find a face in an image.


References:
[1] https://www.javatpoint.com/unsupervised-machine-learning

Probability and Statistical Operation Using Python

 STATISTICS AND POBABILITY  STATISTICS: The process of gathering information, tabulating it, and interpreting it numerically is known as sta...