HIERARCHICAL CLUSTERING
Hierarchical Clustering is a method of cluster analysis in data mining that creates a hierarchical representation of the clusters in a dataset. The method starts by treating each data point as a separate cluster and then iteratively combines the closest clusters until a stopping criterion is reached. The result of hierarchical clustering is a tree-like structure, called a dendrogram, which illustrates the hierarchical relationships among the clusters.
Hierarchical clustering has several advantages over other clustering methods:
- The ability to handle non-convex clusters and clusters of different sizes and densities.
- The ability to handle missing data and noisy data.
- The ability to reveal the hierarchical structure of the data, which can be useful for understanding the relationships among the clusters.
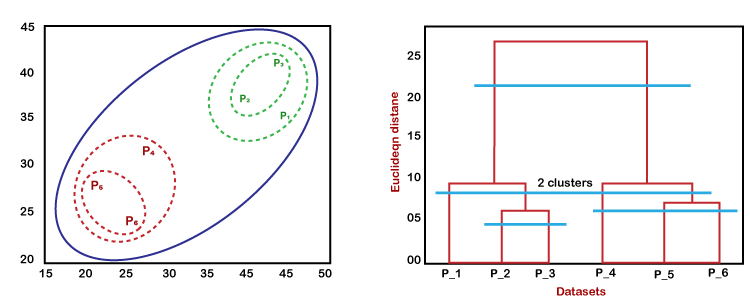
The dendrogram is a tree-like structure that is mainly used to store each step as a memory that the HC algorithm performs. In the dendrogram plot, the Y-axis shows the Euclidean distances between the data points, and the x-axis shows all the data points of the given dataset.
The working of the dendrogram can be explained using the below diagram:

- In the above diagram, the left part is showing how clusters are created in agglomerative clustering, and the right part is showing the corresponding dendrogram.
- As previously said, the datapoints P2 and P3 come together to form a cluster, and as a result, a dendrogram connecting P2 and P3 in a rectangle shape is made.
- The Euclidean distance between the data points is used to determine the height.
- P5 and P6 cluster together in the following stage, and the matching dendrogram is made.
- Given that the Euclidean distance between P5 and P6 is somewhat larger than that between P2 and P3, it is higher than it was previously.
- Once more, two new dendrograms are made, one combining P1, P2, and P3 and the other combining P4, P5, and P6.
Eventually, all of the data points are combined to generate the final dendrogram.
We can cut the dendrogram tree structure at any level as per our requirement.
.png)


Your blog is my go-to for great content.
ReplyDeleteFound it really helpful.
ReplyDelete